/
Trade Performance
Trade Performance
- Sai Man Wong
- Brent Bergh
- Noah Keats
- Oleg Barshay
Owned by Sai Man Wong
Last updated: Jun 02, 2014 by Brent Bergh
The Trade Performance report helps you identify possible trends in your trading activity by examining your trades over a specified period of time and breaking down Wins and Losses by:
- Long vs Short
- Time of Entry (note: if a time period has no trading activity, it will not be displayed. The Time of Entry is only based on the time the trade is initiated, and does not factor in the closeout time-frame.)
- Day of the Week
- Traded Security
- Instrument Type (equities, options, futures, etc)
Understanding the Trade Performance Report
Below is a snapshot of a the Trade Performance report with sample trade data.
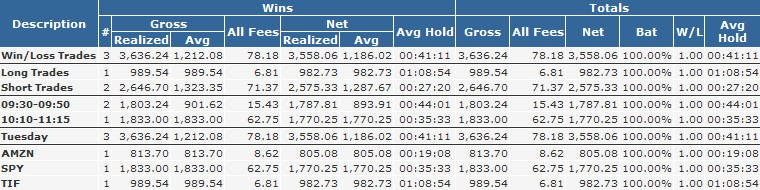
Statistics
| Column | |
|---|---|
| BAT | "Batting Average" is the percentage of winning trades |
| W/L | "Win / Loss Ratio" is the average net gain in winning trades / average net loss in losing trades |
| Avg Hold | "Average Hold Time" is the total of all hold times divided by the number of completed trades. Hold time for each completed trade is the time elapsed between the first transaction making up the trade and the last. |
Completed Trades
All statistics are based on completed or "round trip" trades. A completed trade is defined as a set of transactions from the time a position is opened until the time it goes flat. For example, given the following fills:
| Date | Side | Shares | Symbol | Price |
|---|---|---|---|---|
| Monday | B | 100 | XYZ | $1.00 |
| Tuesday | S | 50 | XYZ | $2.00 |
| Wednesday | S | 50 | XYZ | $2.00 |
The Trade Performance report would calculate one trade, realizing a $100 profit, and is counted for Wednesday.
Wash Trades
A wash trade is a trade where the net profit or loss is exactly $0.00.
, multiple selections available,
Related content
Trade Performance by Account
Trade Performance by Account
Read with this
Totals by Date Report
Totals by Date Report
Read with this
Balances
Balances
Read with this
Realized and Unrealized Profit or Loss
Realized and Unrealized Profit or Loss
Read with this
Posting Adjustments
Posting Adjustments
Read with this