Top/Bottom Ten
Understanding the "Top/Bottom Ten" Report
The Top/Bottom Ten report allows you to review the top ten and bottom ten performers across your entire firm. Because this report uses data from all groups and accounts in your PropReports instance, it is only available to superusers.
Below are snapshots of the Top/Bottom Ten report with sample trade data:
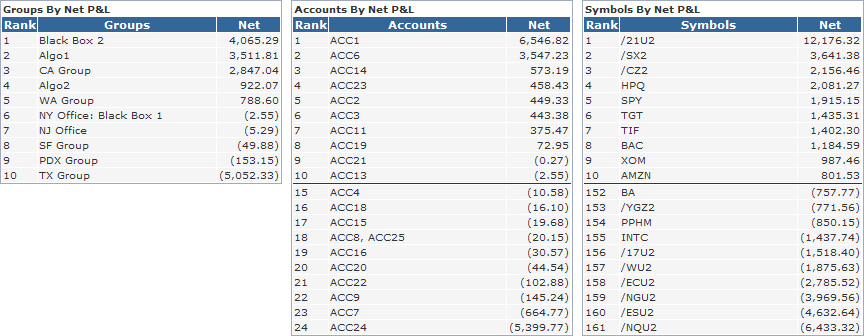
Net Profit and Loss
The top row displays the top ten and bottom ten groups, accounts and symbols by net P&L.
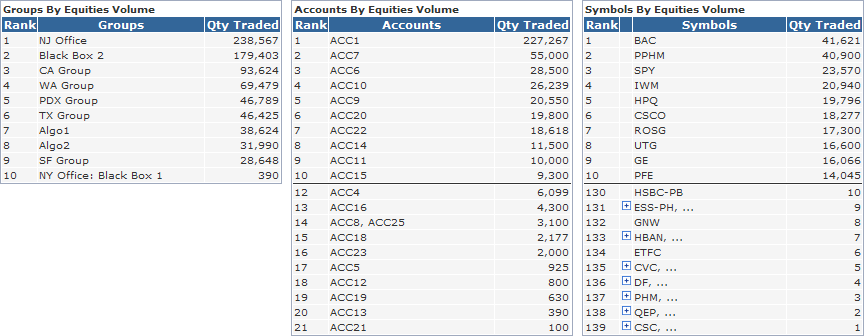
Trade Volume
A separate row displays the top ten and bottom ten groups, accounts and symbols by volume.
![]() Tip: If more than two accounts are competing for a position, a "
Tip: If more than two accounts are competing for a position, a "  " will appear. Expand the box to see its competitors.
Options, FX, Futures
Additional rows will appear for each type of security traded (equities, options, etc).
